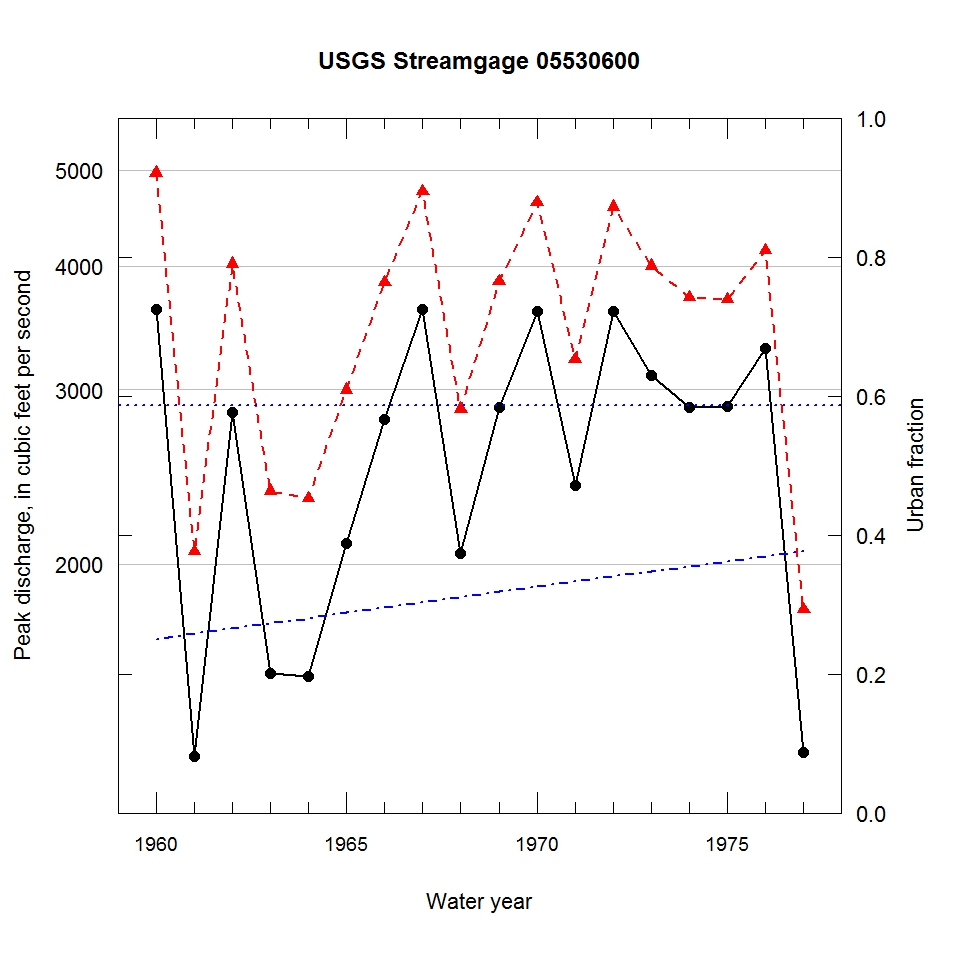
Observed and urbanization-adjusted annual maximum peak discharge and associated urban fraction and precipitation values at USGS streamgage:
05530600 DES PLAINES RIVER AT RIVER GROVE, IL


| Water year | Segment | Discharge code | Cumulative reservoir storage (acre-feet) | Urban fraction | Precipitation (inches) | Observed peak discharge (ft3/s) | Adjusted peak discharge (ft3/s) | Exceedance probability |
| 1960 | 1 | -- | 6822 | 0.250 | 0.542 | 3620 | 4970 | 0.219 |
| 1961 | 1 | -- | 6822 | 0.258 | 1.330 | 1280 | 2060 | 0.859 |
| 1962 | 1 | -- | 7316 | 0.265 | 0.003 | 2850 | 4020 | 0.393 |
| 1963 | 1 | -- | 7316 | 0.273 | 1.315 | 1550 | 2370 | 0.797 |
| 1964 | 1 | -- | 7533 | 0.281 | 0.758 | 1540 | 2330 | 0.804 |
| 1965 | 1 | -- | 7533 | 0.288 | 0.512 | 2100 | 3000 | 0.643 |
| 1966 | 1 | -- | 7533 | 0.296 | 1.174 | 2800 | 3850 | 0.432 |
| 1967 | 1 | -- | 7533 | 0.303 | 1.500 | 3620 | 4760 | 0.251 |
| 1968 | 1 | -- | 7533 | 0.311 | 0.988 | 2050 | 2870 | 0.676 |
| 1969 | 1 | -- | 7573 | 0.318 | 1.358 | 2880 | 3860 | 0.429 |
| 1970 | 1 | -- | 7573 | 0.326 | 1.537 | 3600 | 4640 | 0.269 |
| 1971 | 1 | -- | 7573 | 0.333 | 0.085 | 2400 | 3220 | 0.588 |
| 1972 | 1 | -- | 8473 | 0.341 | 1.087 | 3600 | 4590 | 0.279 |
| 1973 | 1 | -- | 8573 | 0.348 | 1.373 | 3100 | 4000 | 0.397 |
| 1974 | 1 | -- | 8573 | 0.355 | 0.603 | 2880 | 3720 | 0.461 |
| 1975 | 1 | -- | 8573 | 0.362 | 0.790 | 2890 | 3700 | 0.465 |
| 1976 | 1 | -- | 8573 | 0.370 | 1.183 | 3300 | 4150 | 0.366 |
| 1977 | 1 | -- | 8733 | 0.377 | 1.071 | 1290 | 1800 | 0.907 |

